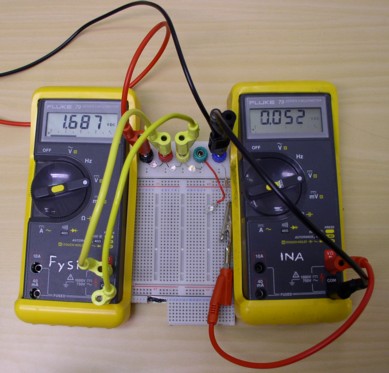
The yellow LED shows a forward voltage of 1.851 V at 5.0 mA
and (on mouse over the image) 1.687 V at 52 µA.
Choose some semiconductor diode (LED, zener, photodiode or rectifier diode) and connect it in
series with a 1 kOhm or 10 kOhm resistor. Make a plot of the current through the diode as a function of the
voltage over the diode. (The current is determined from the voltage over the resistor.)
Use both both polarities. Your measurements should be spread out over many decades in current.
Make a semi-logarithmic plot of the diode current as a function of voltage. How large is the slope?
Does it agree with the diode equation?
Also take a zener diode in series with a 1 kOhm resistor. Measure the avalanche current as a function of reverse voltage, focusing on the region around the nominal zener voltage. Plot your data.
In order to perform measurement on a diode in a water bath with a range of temperatures, a diode 1N4004 with leads in a plastic tube is provided. (Data sheets are available at DIODES etc.)
Use the multimeter's diode test function to measure the typical forward voltage of this diode. What happens when you warm the diode with your fingers? Using water temperatures, you can make a plot of the forward voltage as a function of temperature over a wide range between freezing and boiling. What is your experimental value for the slope of this graph?
The theoretical value of this slope is derived in an article by Precker and da Silva, Am. J. Phys. 70 1150-3 (2002) and also in this lab report.
Schools can buy simple experiments for the determination Planck's constant. There is also a course lab experiment att CERN. The experiment was described in The Physics Teacher 35, 108 (1997). But Roger Morehouse has critisized the interpretation of the results American Journal of Physics 66, 12 (1998). Copies of both articles will be available.

Bygg på kopplingsdäck ovanstående krets, som består av ett antal framkopplade lysdioder i seriekoppling med ett motstånd på 1 kΩ. (Lysdiodens platta sida, som också har ett kortare ben, ansluts till den negativa polen.) Bestäm strömmen genom att mäta spänningen över motståndet. Ställ in strömmen på ungefär 1 mA och mät spänningen över varje diod med en annan multimeter. Upprepa försöket för åtminståne två andra ströminställningar mellan 0,1 uA och 10 mA.
Bestäm ljusets vågläng med hjälp av en fickspektrometer eller datorspektrometern. Det finns också en LED Color Chart och Don Klipsteins information.
Gör nu en graf av spänningarna som funktion av diodljusets frekvens. Diskutera betydelsen av grafernas lutning.
                        WHITE 5500-6500K InGaN+phosphor
                        ULTRAVIOLET 370-390nm GaN
                        BLUE 430nm GaN+SiC
                        BLUE 445-485nm InGaN
                        BLUE Silicon Carbide
                        TURQUOISE 495-505nm InGaN
                        GREEN 525nm InGaN
                        YELLOW-GREEN 555-575mn GaAsP & related
                        YELLOW 585-595nm
                        AMBER 595-605nm
                        ORANGE 605-620nm
                        ORANGISH-RED 620-635nm
                        RED 640-700nm
                        INFRARED 700-1300nm
                        True RGB Full Color LED
                        LED Christmas Light Sets

